A new map sketching out climate change hazards across the Lower Mainland has pinpointed specific neighbourhoods in the Tri-Cities that are particularly vulnerable to extreme heat events, air pollution and flooding.
The project, carried out by both Fraser and Vancouver Coastal Health in collaboration with researchers from the University of British Columbia, looks ahead at how climate hazards “do not affect all people equally.”
The researchers used 35 indicators and reviewed more than 280 epidemiological papers to create the maps and determine neighbourhood vulnerabilities based on potential exposure to hazard, their sensitivity and their capacity to adapt.
In the case of exposure, for example, researchers looked at daily maximum temperatures from 2001 to 2010 and predicted how much seas and rivers would rise by 2100.
But that’s not the whole picture.
“It’s not just about where it’s going to be hotter, where are there going to be floods, but it’s also about the health status of the community members and the ability to adapt to those changes,” said Dr. Alex Choi, a Fraser Health medical health officer that’s working on the project.
Sensitivity primarily takes into consideration age of a population — with those under 5 and over 65 being most vulnerable — and what percentage of people have pre-existing health conditions such as cardiovascular or respiratory disease, chronic health conditions and pregnancy.
How a neighbourhood adapts to a climate change hazard can come down to such factors as a person’s income, education, housing status and social supports. That has helped create a starting point to identify the neighbourhoods that could need more resources to cope with future climate shocks.
The project highlights what the Tri-Cities could be up against.
EXTREME HEAT
Some of the jurisdictions predicted to feel the hottest effects of climate change in the Lower Mainland include the municipalities of Tsawwassen, White Rock, Maple Ridge and Langley.
In the Tri-Cities, two heat islands stand out in the high range of the heat vulnerability index, one along the north shore of Moody Inlet in Port Moody and another in a quadrant north of the Trans-Canada Highway opposite the Hard Rock Casino in Coquitlam. Another sliver of predicted extreme heat appears in a patch of land near the border of Port Moody and Anmore.
Most of the Tri-Cities fall in the moderate category of the heat vulnerability index.
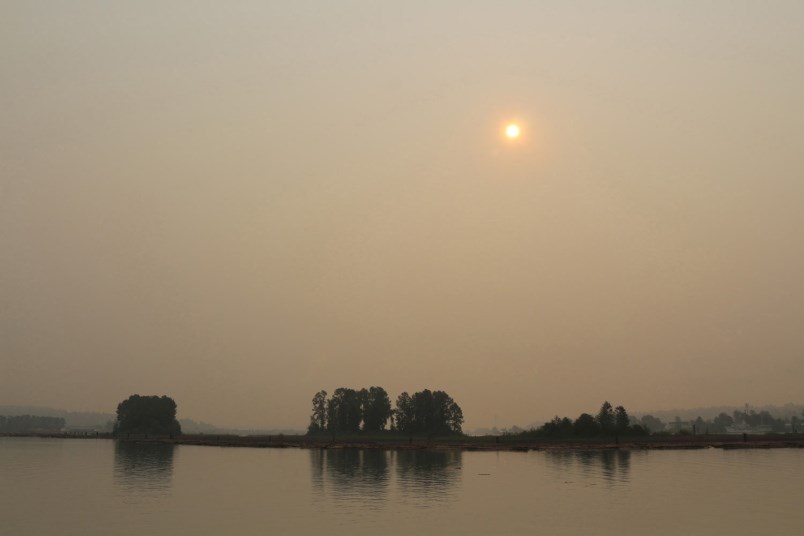
WILDFIRE SMOKE EVENTS
When it comes to the future of deteriorating summertime air quality due to wildfires, the Tri-Cities shows a patchwork of vulnerabilities, all in the low to moderate range.
But that’s not to say that the region won’t be hit by significant air pollution from wildfires. In fact, toggling for exposure, the Tri-Cities is among the hardest hit in the Lower Mainland, with “very high” levels of smoke exposure on par with Maple Ridge, Surrey and sections of south Burnaby.
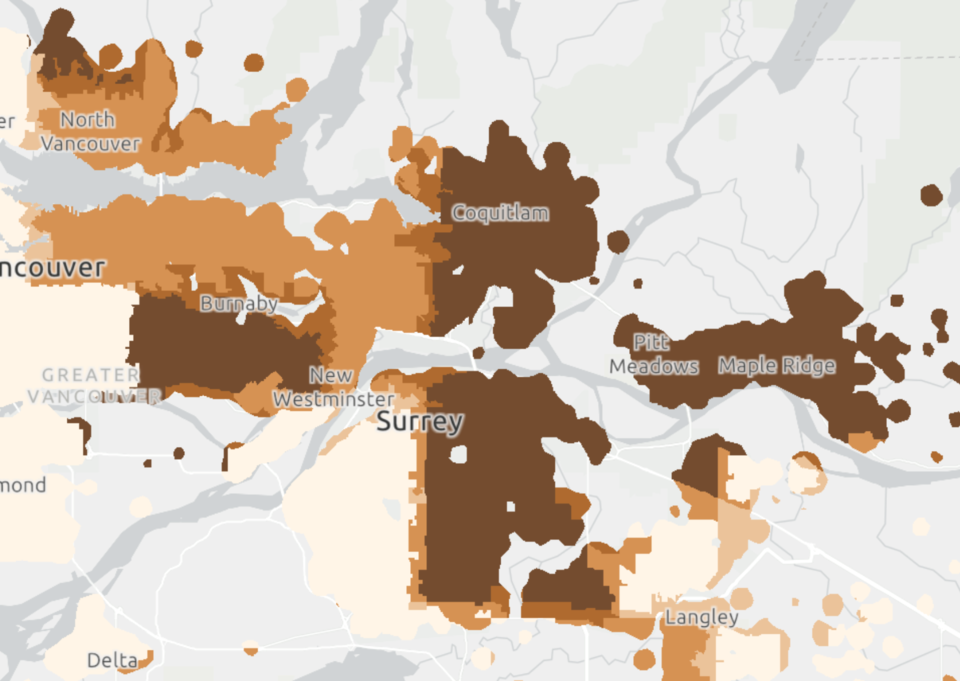
That’s all based on the concentration of lung-damaging airborne particles (defined as PM2.5 concentrations above 25ug/m3) over the five most severe fire seasons between 2009 and 2018.
But when you take into account various neighbourhood demographics and ability to adapt, the region as a whole copes relatively well compared to places like Maple Ridge or parts of Surrey.
“As communities become more prepared, and as demographics change, so too will the maps,” note the authors in an analysis of Coquitlam’s vulnerabilities to wildfire smoke.
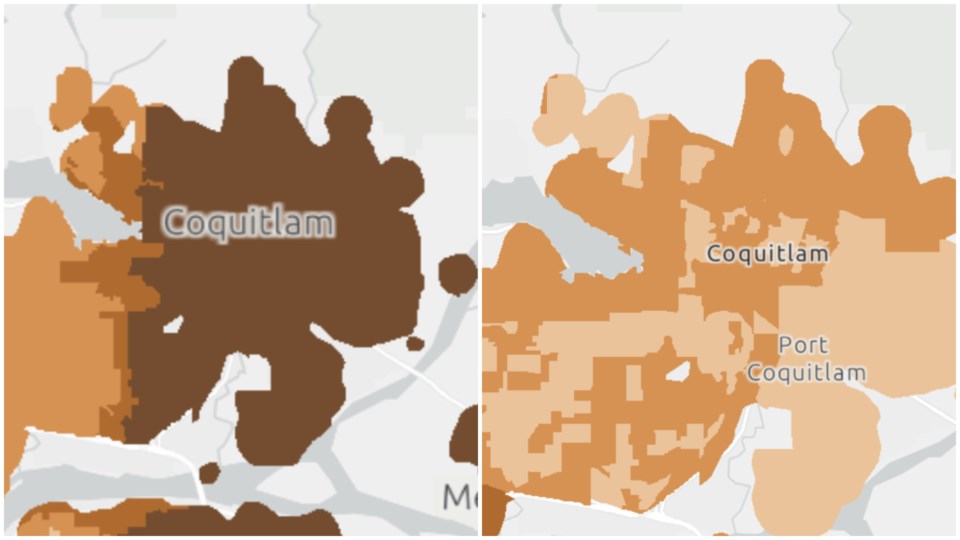
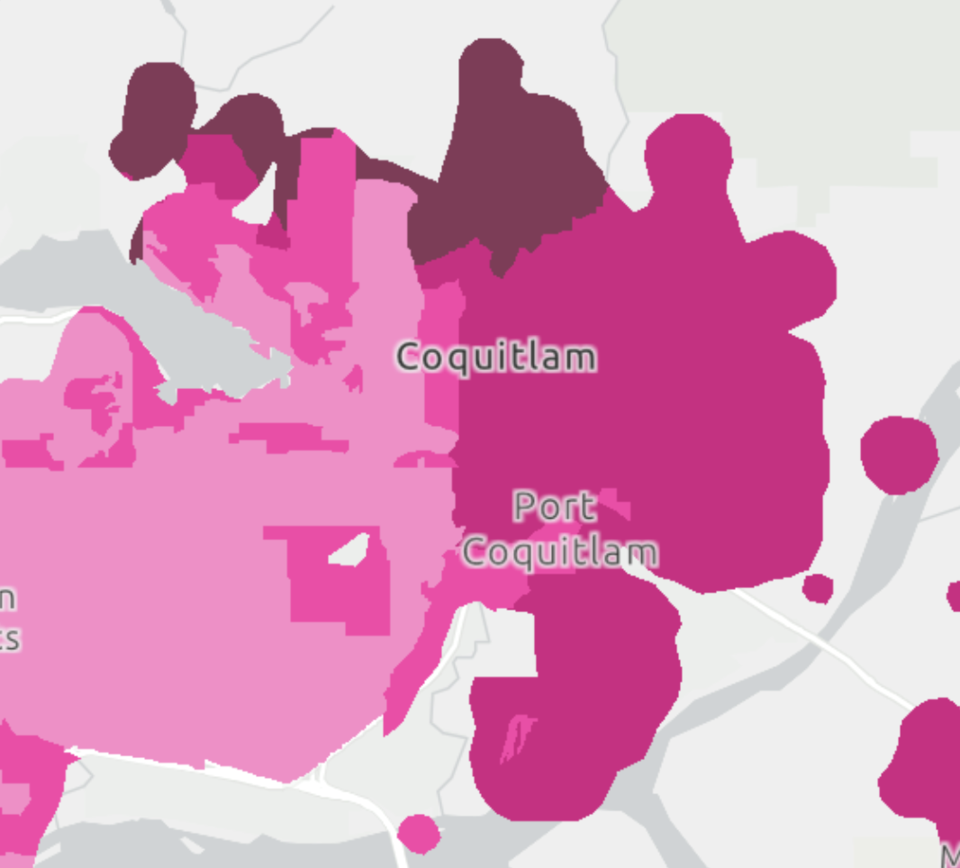
GROUND-LEVEL OZONE
Warmer temperatures can mean higher levels of ground-level ozone, a situation that can make the symptoms of asthma, bronchitis or emphysema even worse. Children, older adults and people who are active outdoors — especially outdoor workers — are especially vulnerable, according to the U.S. Environmental Protection Agency.
“Studies suggest that long-term exposure to ozone also may increase the risk of death from respiratory causes,” notes the agency in a public document on the hazards of climate change.
So, as climate change contributes to more wild swings in extreme weather, researchers predict the health risks to ozone to go up — and the Tri-Cities is not predicted to be spared.
Locally, the eastern half of Coquitlam and most of Port Coquitlam show high vulnerability to ground-level ozone, whereas the northern reaches of the Tri-Cities show very high ozone vulnerabilities.
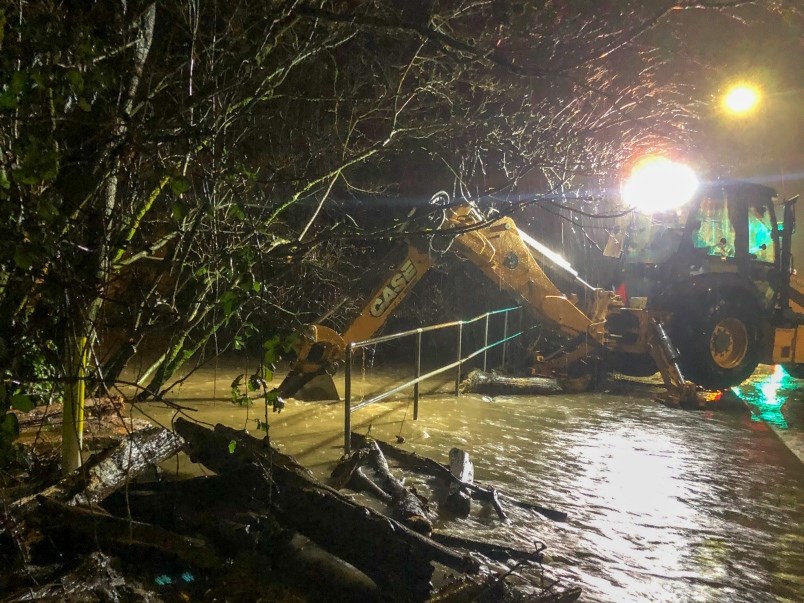
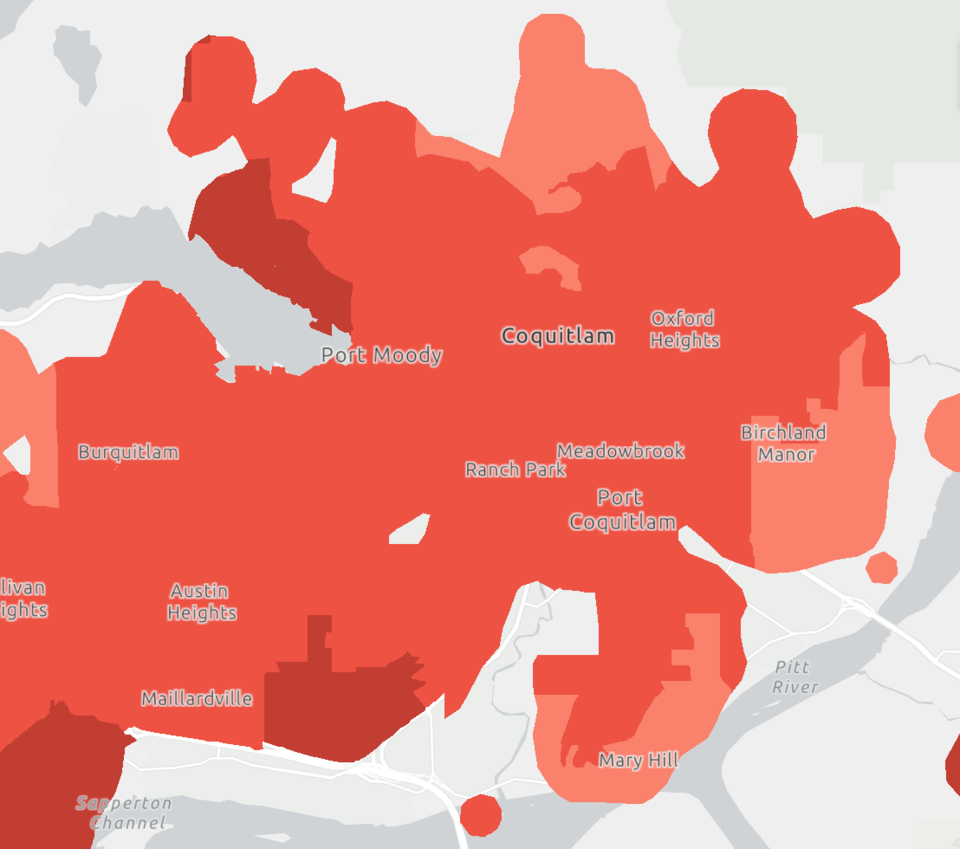
FLOODING
Finally, in what often produces the most violent effects of extreme weather, climate change-induced flooding scenarios across the Lower Mainland show very high levels of vulnerabilities across large areas of the Tri-Cities.
In Port Moody, the entire coastline reaches the “very high vulnerability” threshold, only dipping to “high” in surrounding neighbourhoods. Coquitlam’s Maillardville, a curled swath of land around Mary Hill as well as several neighbourhoods east of Birchland Manor and north of Oxford Heights also show very high levels of flood vulnerability.
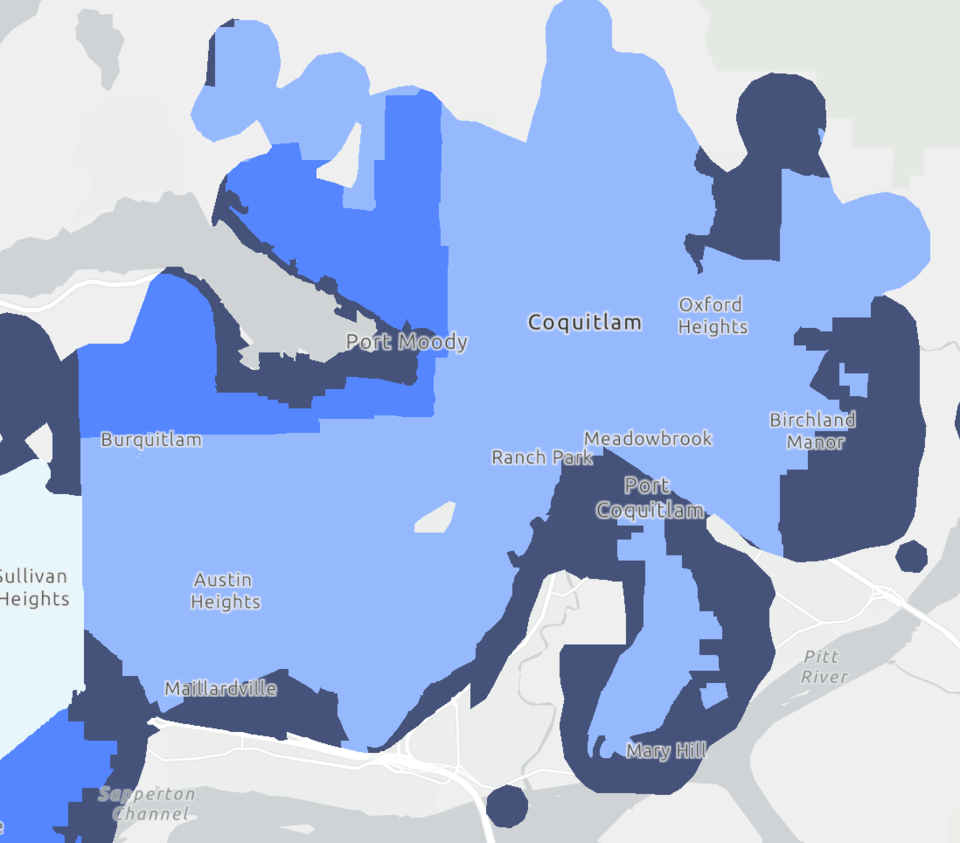
That, the map shows, coincides with surging sea-level rise spilling into waterways and rivers by the year 2100.
A SHIFTING MAP
Both Fraser and Vancouver Coastal Health are now in the process of sending off the data to municipalities across the Lower Mainland and Fraser Valley. By working with local governments and community organizations, their next step is to start a conversation with residents to understand how climate change is affecting their lives.
Updating the population data will be crucial because while projections on extreme heat and flooding look toward 2100, the vulnerabilities in communities are based on the infrastructure and health status of residents now.
That’s why Dr. Choi said they are looking at building connections with anyone looking to close the vulnerability gap, whether that’s installing cooling and water stations or simply getting the word out for people to stay indoors when wildfires threaten air quality.
“Climate change is such a big and complex problem that if we just take action in one part of our society we’re not going to be successful,” said Dr. Choi.


