Ask most Metro Vancouver residents when the most recent peak of the single-family home market was, and they’ll likely tell you around the spring of 2016. After all, that’s when the market was at its most frenzied, with round-the-block lines for open houses, as bidding wars pushed sale prices way over asking, and the foreign buyer tax was not yet launched.
Since then, or at least since 2017, sales of detached homes have slid dramatically, as government cooling measures and a natural market correction took hold. But we at Glacier Media’s real estate division haven’t yet seen this have a huge impact on median sale price trends, so we created this interactive infographic (below) to find out exactly what prices have been doing.
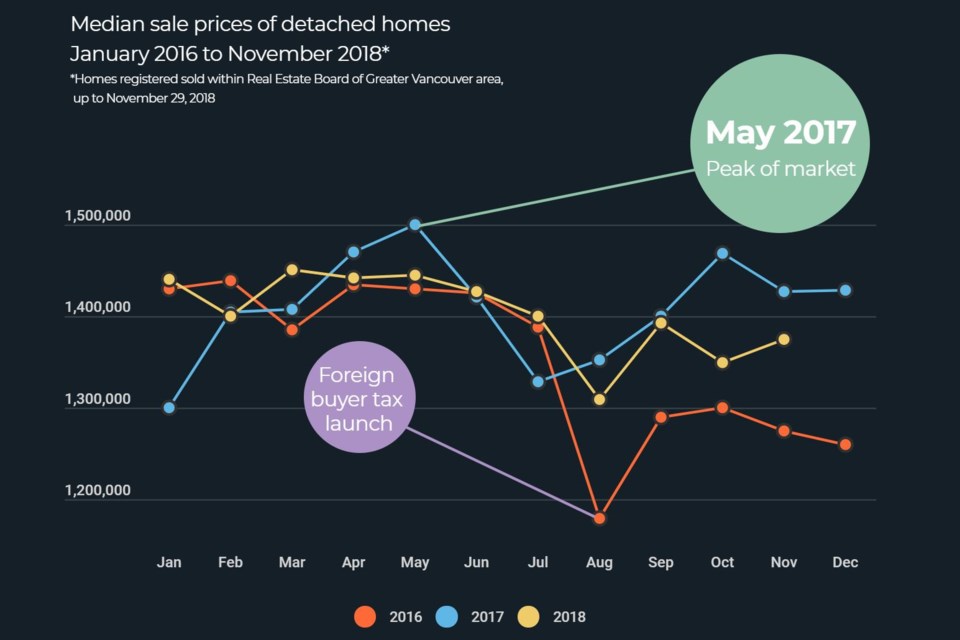
The infographic reveals that Metro Vancouver’s median detached sale prices in 2018 so far have been slightly higher than in 2016, despite popular perception. The price peak was hit in May 2017, but spring 2018 also saw high median prices, as has fall 2018 thus far. Fall 2018 prices are somewhat lower than one year ago, but still higher than in 2016.
However, it’s not all good news for sellers – or bad news for buyers. The infographic reveals that the median number of days on market for a Metro Vancouver detached house has jumped over the past couple of years, while conditions have flipped from a seller’s to a buyer’s market. That means a huge amount more choice for detached home buyers, with inventory outweighing demand. This boost in supply hasn’t significantly brought down detached sale prices yet – but it still could, as analysts predict.
We chose to use median prices rather than averages, as median prices are not skewed by extremes at either end of the market. The same infographic for average prices would show a larger price decline since the market peak, as there have been relatively fewer sales of very high-end homes. The $3 million plus market is the sector where prices are certainly dropping considerably, and the same infographic for that market alone would tell a very different story. Indeed, markets vary widely by different municipalities and neighbourhoods, and within different price ranges. To get a more accurate picture of your price range and neighbourhood, check out the full statistics on the Real Estate Board of Greater Vancouver website.
Check out our interactive infographic, below.


