Correction: Due to an editing error, an earlier version of this story's sub-heading reported that most cases in Fraser Health stem from an 'Eastern European-like and Eastern Canada' lineage of COVID-19. That lineage, in fact, is a 'European-like and Eastern Canada' lineage.
Through much of the pandemic, the Fraser Health region — which includes the Tri-Cities — has seen some of the highest rates of COVID-19 infection in the province, according to data released by provincial health officer Dr. Bonnie Henry Thursday.
The figures, which run from January to the end of May, shows infection rates ranging from between 50.1 to well over 100 cases per 100,000 people. But the province’s public health officials also broke down several of the health authorities into sub-regions. Here we see the Fraser North portion of the health authority — which includes Port Coquitlam, Port Moody, Coquitlam, Burnaby, New Westminster, Maple Ridge, Pitt Meadows, Anmore and Belcarra — register an infection rate of 50.1 and 75 per 100,000.
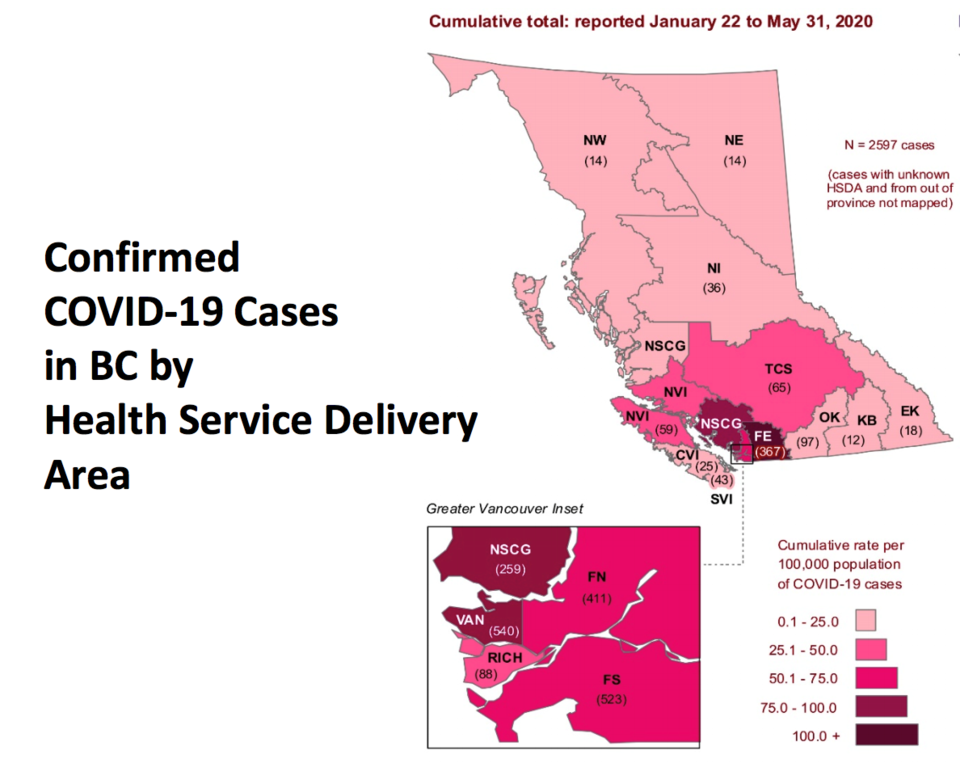
Only Vancouver and the North Shore, which recorded 75.1 to 100 infections per 100,000, and the eastern Fraser Valley portion of Fraser Health, which surged to over 100 per 100,000, had a higher infection rate.
The southern half of Fraser Health had roughly the same per capita infection rate as Fraser North.
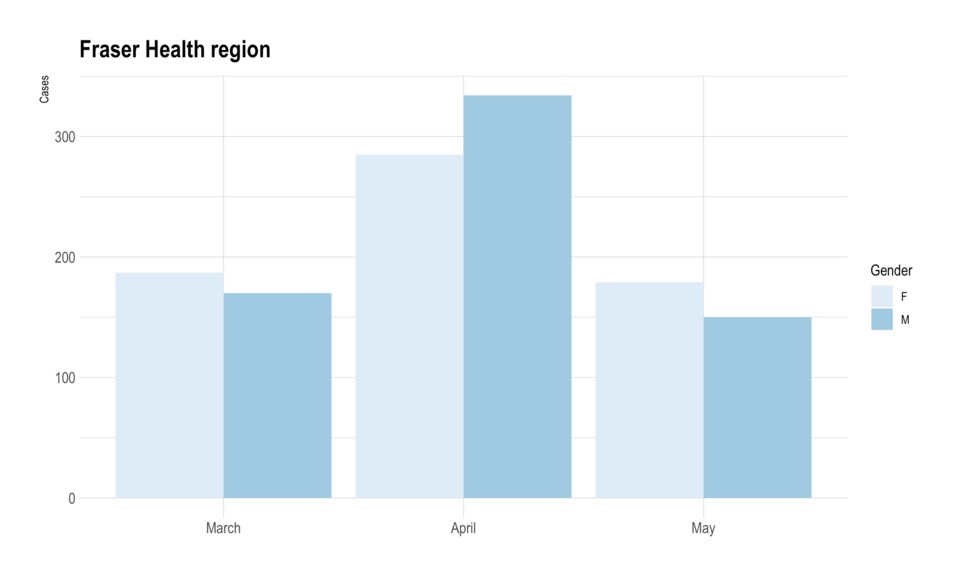
AGE & SEX
Breaking down Fraser Health’s infections by age reveals the highest rates of infection among people aged 30-19 and 50-59 through the months of March and April.
But by May, as overall infections across the region sank, the infections among those 20-29 caught up and led all other age brackets, if only by a small margin.
In the past, provincial health officer Dr. Bonnie Henry has attributed the relatively high number of infections among a younger or middle-aged demographic to people working in health care or food processing facilities.
And while it is often women working in those fields, the infection rate among females is only slightly higher in March and May and overtaken by male infections at the Fraser Health’s peak caseloads in April.
TRI-CITY COMMUNITY OUTBREAKS
Despite the data released by the province, health authorities have yet to provide municipality-level reporting as seen in places like Ontario. In parts of the United States, data is even broken down on a neighbourhood level, offering what some epidemiologists say amounts to invaluable data offering a window into how the virus disproportionately affects populations based on indicators like ethnicity and poverty.
But while we don’t have city-level data, we can still match our reporting of past community outbreaks in the Tri-Cities with the raw daily caseloads from across Fraser Health.
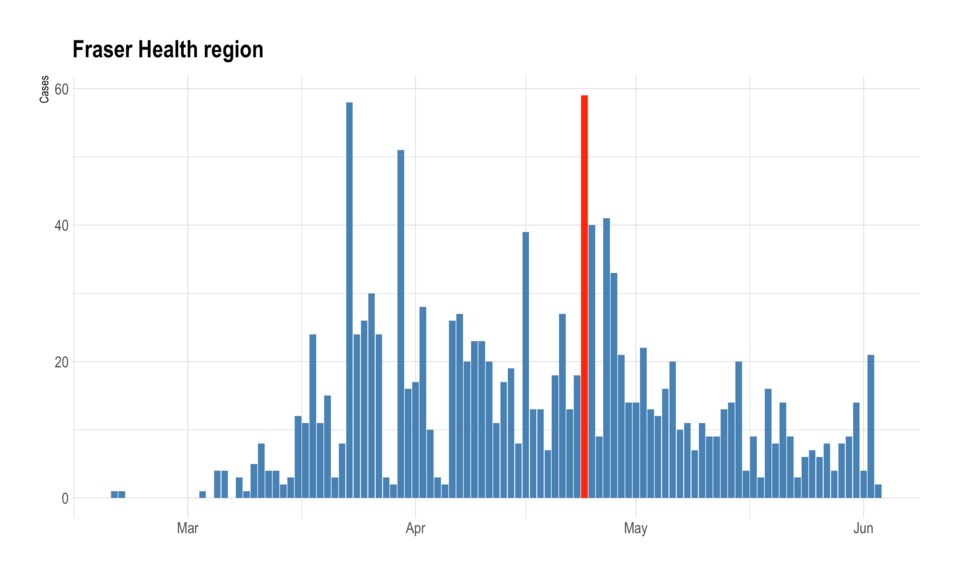
In one of the clear outliers, we see that the largest one-day spike in infections from the entire period coincides with an outbreak at the Superior Poultry plant in Coquitlam, where 61 cases of COVID-19 eventually hit the workforce.
Other spikes around this time were recorded at the Mission Institute, a federal correctional facility where 120 inmates were ultimately infected with the contagion before the outbreak was declared over May 28.
ORIGINS OF THE CONTAGION
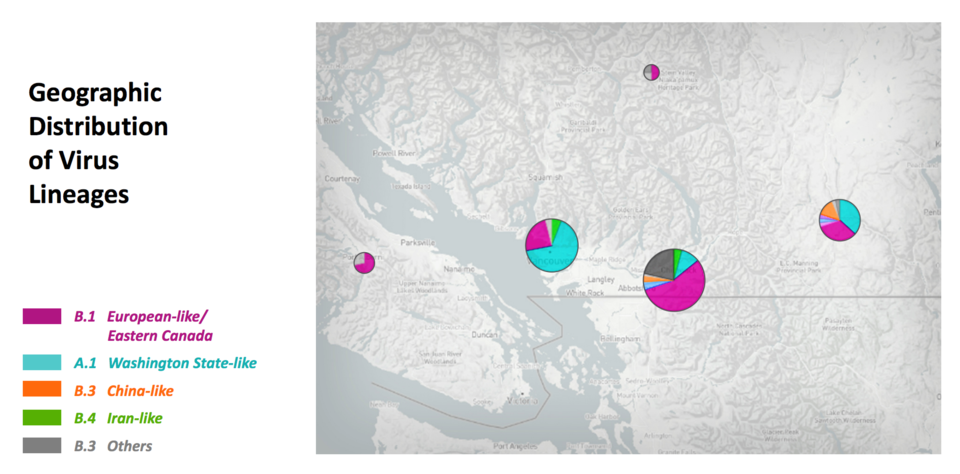
One of the most vivid portraits of the virus’s migration to the province came from what Dr. Henry called “leading edge work” in genomic sequencing.
"This is the first time that we've been able to rapidly sequence genomes to help us understand the trajectory of our pandemic in a very short period of time,” she said.
The modelling shows that when the virus first arrived in B.C. in January and February, Chinese and Iranian strains of the virus were most prevalent. In the case of Iran, B.C. health officials were some of the first to raise sound a warning over an infected traveller returning from Iran at a time when the disease was already circulating relatively undetected in the country.
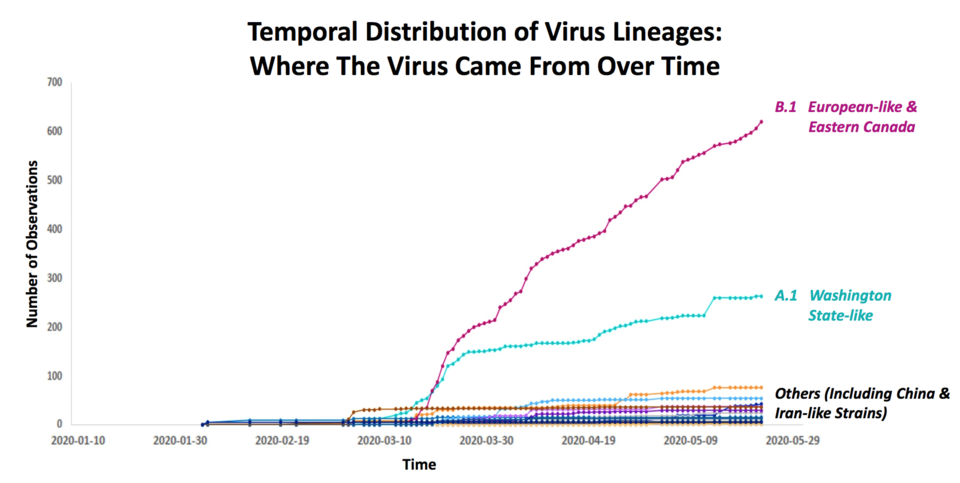
But by mid-March, new lineages of the virus began to surge in the province, first from Washington state and then what the B.C. Centre for Disease Control calls a “European-like and Eastern Canada” lineage. Across the Vancouver Coastal Health Region, the “Washington state-like” lineage has led to the majority of cases, and in the Fraser Health region, the “European-like and Eastern Canada” strains have made up over half of all cases.
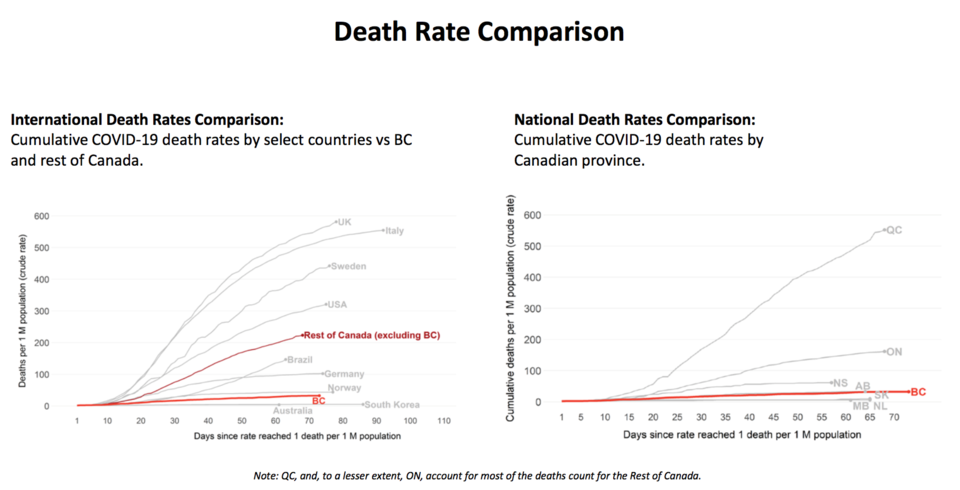
B.C. VERSUS THE WORLD
The modelling also compared B.C.’s infection and death rates — measured in cases per one million — with other jurisdictions around the world. With the exception of Australia and South Korea, B.C. had the lowest total diagnosed cases and death rates.