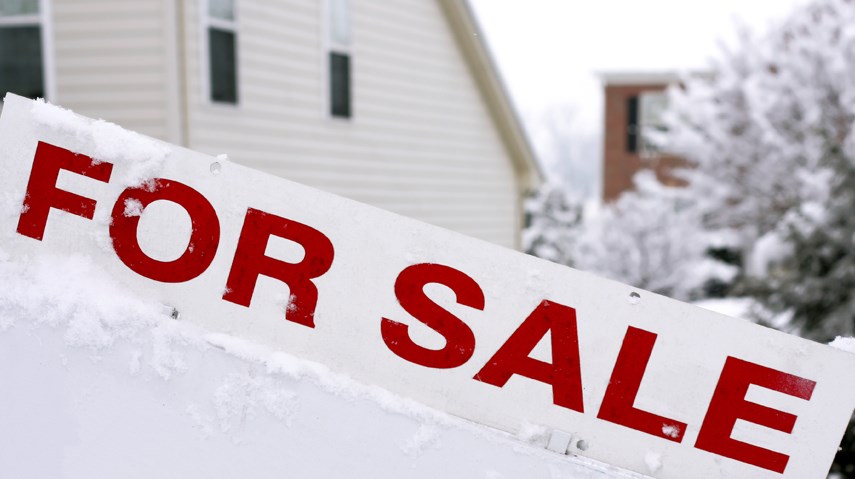
A combination of unsustainably high home prices, rising interest rates, increased taxes and the mortgage stress test are being held responsible for slow residential real estate market activity in Metro Vancouver, according to statistics released today.
There were 24,619 home sales across Metro Vancouver in 2018, which is the lowest full-year total since 2000, and 31.6 per cent lower than 2017, the Real Estate Board of Greater Vancouver (REBGV) reported January 3.
This figure is also 25 per cent below the 10-year average annual home sales for the region, and 38.4 per cent below the very busy market of 2016.
Phil Moore, REBGV president, said, “This past year has been a transition period for the Metro Vancouver housing market away from the sellers’ market conditions we experienced in previous years. High home prices, rising interest rates and new mortgage requirements and taxes all contributed to the market conditions we saw in 2018.”
(Story continues below)
The board also reported on statistics for December alone, in which Metro Vancouver home sales plunged year-over-year by 46.8 per cent to 1,072 units. This is also 36 per cent lower than the 1,608 sales in November 2018 as potential buyers concerned themselves more with festivities than home purchases.
Sellers also responded to both the slowing market and the holiday season by staying on the sidelines. There were just 1,407 homes newly listed for sale on the MLS® in Metro Vancouver in December, which is 25.6 per cent lower than in December 2017 and a 59.3 per cent decrease in the month November 2018.
With absorption rates low, the total number of homes currently listed in Metro Vancouver is 10,275, a 47.7 per cent increase compared with the low inventory of December 2017. However, it’s 16.5 per cent lower than the active listings of November this year.
Combining all property types, the sales-to-active listings ratio for December 2018 is 10.4 per cent. That means is the first time in many years Metro Vancouver has entered buyer’s market territory, although it will need to remain below 12 per cent for a few months before it is officially a buyer’s market. As ever, the market varies by property type, with detached homes in a very firm buyer’s market at just 7.1 per cent, and townhomes and condos still holding onto balanced market conditions – although sliding – at 12 per cent and 14.2 per cent respectively.
With buyers gaining control, home prices slid a little further downwards in December. The board’s composite benchmark home price (all property types combined) ended 2018 at $1,032,400, a 2.7 per cent decrease from that of December 2017.
“As the total supply of homes for sale began to accumulate in the spring, we began to see downward pressure on prices across all home types throughout the latter half of the year,” said Moore.
Sales and prices by property type and area
There were just 348 sales of detached homes in December 2018 across Metro Vancouver, which is 43.6 per cent lower than December 2017 and 32.5 per cent lower than November 2018. The benchmark price for a detached home in the region is now $1,479,000, down 7.8 per cent compared with December 2017, and down 1.4 per cent since November.
The steepest annual benchmark price declines were unsurprisingly seen in West Vancouver (-13.5 per cent) and Vancouver West (-11.8 per cent), followed by Burnaby East (-10.6 per cent). However, some non-urban areas’ detached markets remained relatively robust, primarily the Sunshine Coast (+5.8 per cent) and Bowen Island (+5 per cent).
Sales of attached homes such as townhomes, rowhouses and duplexes in December 2018 totalled a mere 189 across the region, a 49.1 per cent plunge from December 2017 and down 32.9 per cent from November 2018. However, although the townhome benchmark prices has fallen 5.3 per cent off its 2018 spring peak and is 1.1 per cent lower than in November, it is still 1.3 per cent higher than one year previously, standing at $809,700.
Townhome benchmark prices performed strongest on an annual basis in Pitt Meadows (up 8.2 per cent), Burnaby East (+5.6 per cent) and Port Moody (+5.1 per cent). At the other end of the scale, attached properties in five areas saw year-over-year price declines: Vancouver East (-3.3 per cent), Ladner (-2.1 per cent), Tsawwassen (-0.8 per cent), Vancouver West and Burnaby North (both -0.5 per cent).
Some 535 condo units traded hands across the region in December, which is a 34 per cent decrease compared to the 1,028 sales in December 2017 and 34 per cent lower than November 2018. Like attached homes, the benchmark price of condo has fallen since spring 2018 but is still 0.6 per cent higher than a year ago, at $664,100.
New Westminster is still a star performer in the condo market, with benchmark prices up 7.4 per cent year over year, followed by Tsawwassen (+6.5 per cent) and Ladner (+5.8 per cent). The steepest condo benchmark decline over the past year was seen in Vancouver West (down 2.9 per cent) with West Vancouver, Vancouver East, Whistler, Squamish, Port Moody and North Vancouver also seeing slight annual drops in the value of a typical condo.
Home prices vary widely in different areas throughout the region. To get a good idea of home prices in a specific location and by property type, check the detailed MLS® Home Price Index in the full REBGV stats package.

