Researchers at Simon Fraser University have unveiled a series of maps painting one of the most detailed pictures yet of how different neighbourhoods across British Columbia are vulnerable to COVID-19.
The risk models, built with census data and other public records, break down vulnerability to COVID-19 based on the risk profiles of a neighbourhood’s residents and its built environment.
“The most important decision-makers in a pandemic are ordinary British Columbians,” said lead researcher Valorie Crooks. “These maps help them understand the complexity of the pandemic.”
A PATCHWORK OF RISK
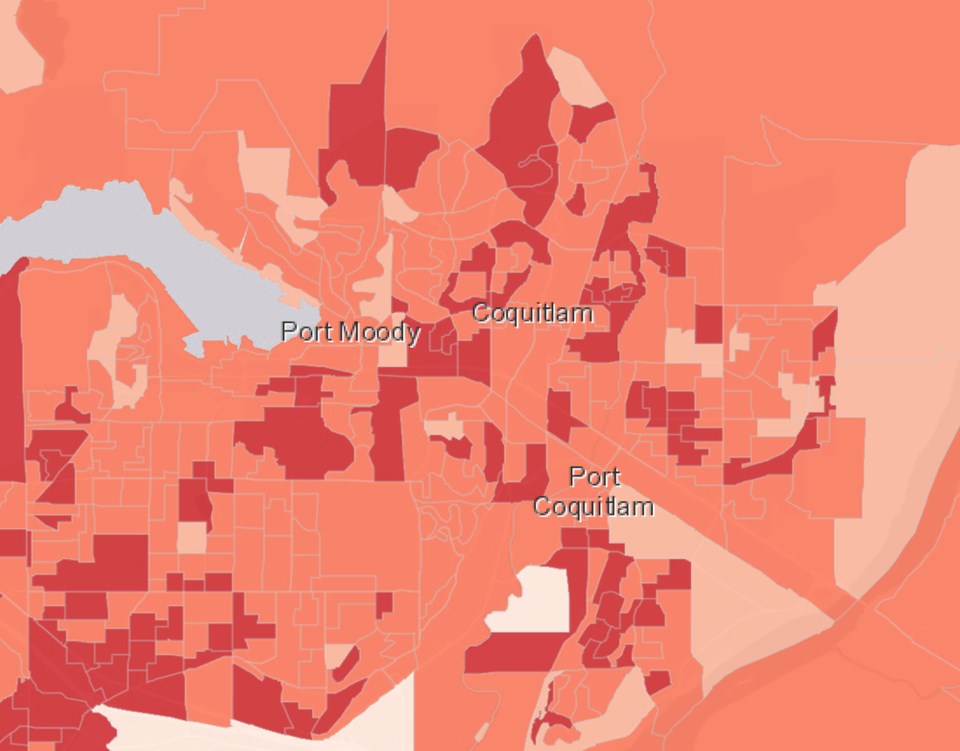
In one map, a patchwork of red ranks the contours of personal risk — whether residents of a neighbourhood live in crowded conditions, work outside of the home or in a high-risk industry, or sit at the bottom of the social-economic ladder.
Zoom in to the Tri-Cities and you will note large high-risk swaths of Port Coquitlam, where more than 92% of the labour force works outside the home, or a quadrant of Coquitlam centred around Westwood Mall, where up to 66% of households have more than one person per room.
A second map looks at built environments (each area represents a census dissemination area of between 400 and 700 people), building a hierarchy of risk based on the density of bars and restaurants, schools and daycares, or food processing facilities and long-term care beds. The number of university residences, places of worship, tourism destinations and airports are also factored in to the risk model.
Panning across the Tri-Cities, Crooks said the urban and suburban landscape paints a patchwork of vulnerabilities to the contagion.
“There’s a huge amount of variation in terms of risk,” she said. “We can’t become complacent, even within our own neighbourhoods.”
EDUCATING PEOPLE WHO IGNORE RISK
There’s a body of research that has found certain groups of people ignore risk more than others.
But as Crooks put it, the maps are not meant to assign blame or “launch a witch hunt,” and nobody should change the route they walk their dog or abandon their favourite grocery stores.
Much of the data in the maps have already been reported or made public. But even for the most die-hard news junkies, their novelty lies in bringing everything we know about population risk and COVID-19 together into one place.
“Risk can be very different in places really close to you,” said Crooks, noting the maps offer stark visual reminders as to why health officials are warning people not to stray far from home.
DATA VOID PAINTS INCOMPLETE PICTURE
The maps are also meant to offer a baseline for policymakers as they work out who should receive COVID-19 vaccines first.
As one of “the most granular maps out there,” Crooks said it “can help us to justify which communities to prioritize.” At the same time, they show more granular data can be released without compromising personal privacy.
But the maps are not without their limitations, something the SFU researchers said is in part due to a lack of local epidemiological data from the province.
Compared to some jurisdictions in the United States and Ontario, for example, B.C. releases a paltry amount of COVID-19 transmission data at the local level.
“There are huge voids between who generates data and who uses it,” said Crooks. “There’s going to have to be a massive data release coming from the ministry of health.”
Because if you’re following the science of the pandemic, trying to crunch the numbers, she added, “the resolution of the data they provide, it’s just not meaningful.”
FUTURE PANDEMIC FALLOUT
Described as “a living project,” Crooks and her team are busy at work developing a second set of risk models for the province's neighbourhoods, this time focused on the knock-on health effects of the pandemic, including those who have lost jobs and are unable to pay rent.
“We can show more granularity than what is being put out publicly,” said Crooks. “People are really hungry for information in B.C.”


